
Google Sheets isn’t just a spreadsheet—it’s your dashboard for real-time finance. At the heart of this magic is the powerful using googlefinance in google sheets function, which delivers up-to-the-minute market data, historical trends, and even currency conversions directly into your sheets.
What Is the GOOGLEFINANCE Function?
The GOOGLEFINANCE function acts as a bridge between Google Finance data and your spreadsheet. It allows you to retrieve real-time or historical financial information for stocks, mutual funds, and currency pairs—right in Google Sheets.
Syntax Overview
GOOGLEFINANCE(ticker, [attribute], [start_date], [end_date | num_days], [interval])
- ticker (required): Security or currency (e.g.,
"NASDAQ:GOOG"or"CURRENCY:USDINR"). - attribute (optional): Type of data (e.g.,
"price","volume","pe"). Defaults to"price". - start_date, end_date/num_days, interval (all optional): Retrieve historical data over a date range with daily or weekly intervals.
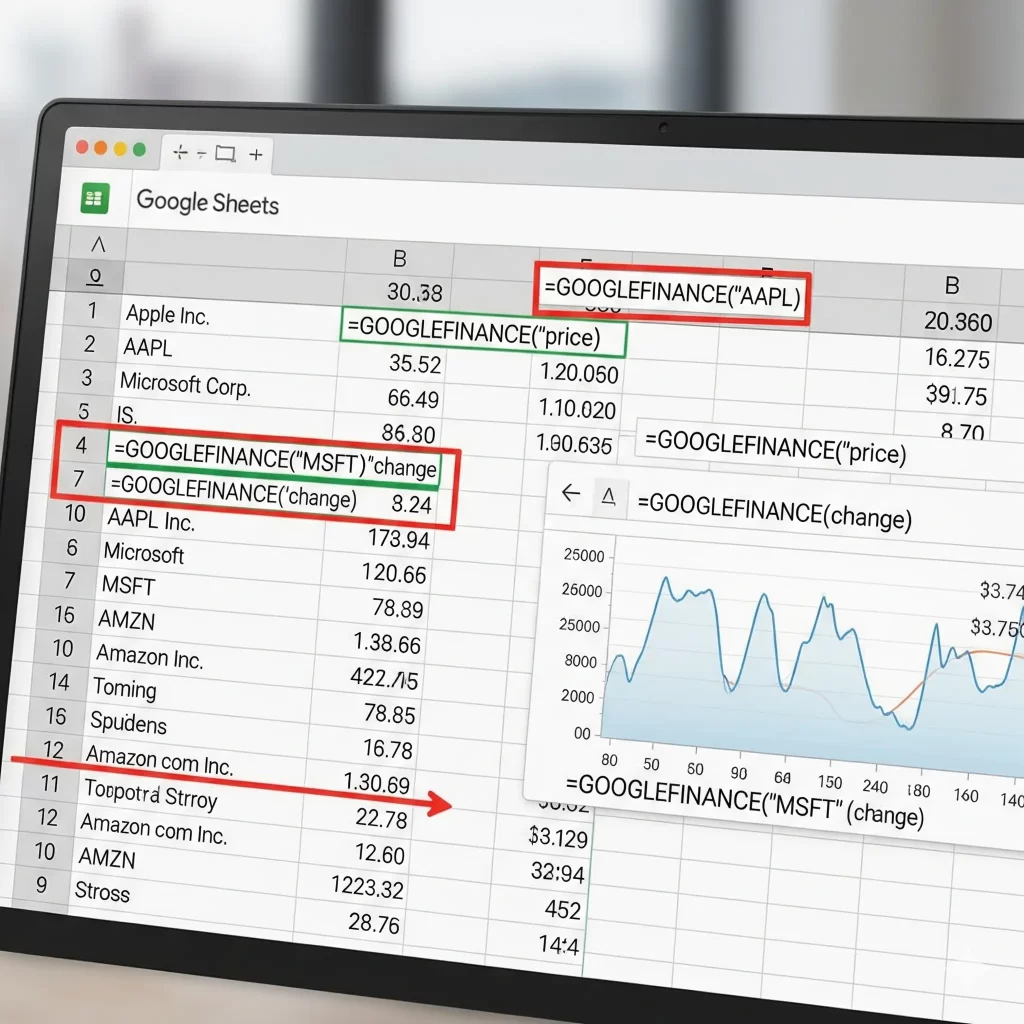
Practical Examples You Can Use Today
A. Real-Time Stock Price
=GOOGLEFINANCE("AAPL", "price")
Or simply:
=GOOGLEFINANCE("AAPL")
This pulls Apple’s current stock price.
B. Get Today’s High, Low, and Volume
=GOOGLEFINANCE("GOOGL", "high")
=GOOGLEFINANCE("GOOGL", "low")
=GOOGLEFINANCE("GOOGL", "volume")
Great for building richer stock dashboards.
C. Historical Price Data
=GOOGLEFINANCE("MSFT", "close", DATE(2025,1,1), DATE(2025,1,31), "DAILY")
This returns a table of closing prices for Microsoft in January 2025.
D. Convert Currency (e.g., USD to EUR)
=GOOGLEFINANCE("CURRENCY:USDEUR")
Instant conversion in your sheet.
E. Historical Exchange Rates
=GOOGLEFINANCE("CURRENCY:USDGBP", "price", TODAY() - 7, TODAY(), "DAILY")
Get daily USD to GBP rates for the past week.
Why It’s a Game-Changer
- Saves time: No copying data from financial websites.
- Automates updates: Sheets refresh with the latest market data.
- Highly customizable: Create dashboards, conditional alerts, and aggregated views.
Advanced Applications
- Bulk tracking with cell references
If A2 has a ticker, use:=GOOGLEFINANCE(A2, "marketcap") - Daily change percentage
=GOOGLEFINANCE("TSLA", "change") - Integrated averages
=AVERAGE(ARRAYFORMULA(GOOGLEFINANCE("FB", "close", DATE(2025,1,1), DATE(2025,1,31)))) - Transparent portfolios
Combine metrics across tickers using SUM, VLOOKUP, or QUERY.
Tips & Pitfalls to Watch For
- Data may lag up to ~20 minutes.
- Ensure proper ticker symbols—use exchange prefixes when needed (e.g.,
"NSE:TCS"or"LON:HSBA"). - Limitations exist—some exchanges or niche assets may not be supported.
- Errors may occur (#N/A etc.)—often caused by incorrect input or temporary glitches.
Unlocking Advanced Capabilities with GOOGLEFINANCE in Google Sheets
Google Sheets offers a powerful tool for financial analysis through its built-in GOOGLEFINANCE function. While we’ve previously covered the basics, let’s delve into more advanced applications to enhance your financial tracking and analysis capabilities.
1. Tracking Multiple Stocks Simultaneously
Managing a diverse portfolio can be streamlined by tracking multiple stocks in a single sheet. By referencing ticker symbols in cells, you can dynamically pull data for various stocks.
For instance, if cell A2 contains “GOOGL” and A3 contains “AAPL”, you can use:
=GOOGLEFINANCE(A2, "price")
=GOOGLEFINANCE(A3, "price")
This approach allows for easy updates and comparisons across different stocks.
2. Calculating Portfolio Performance
To assess the performance of your investment portfolio, you can calculate the total value by multiplying the number of shares held by the current price.
Assuming:
- Column A lists ticker symbols (e.g., “GOOGL”, “AAPL”)
- Column B lists the number of shares owned
- Column C will display the current price
You can use the formula:
=GOOGLEFINANCE(A2, "price") * B2
This will give you the current value of your holdings in each stock.
3. Visualizing Historical Data Trends
Analyzing historical data is crucial for understanding market trends. You can fetch historical data using:
=GOOGLEFINANCE("GOOGL", "close", DATE(2024,1,1), DATE(2024,12,31"), "DAILY")
This will provide daily closing prices for Google throughout 2024. You can then use Google Sheets’ charting tools to create visual representations, such as line graphs, to identify trends and patterns.
4. Currency Conversion and Analysis
The GOOGLEFINANCE function can also be used for real-time currency conversion. For example:
=GOOGLEFINANCE("CURRENCY:USDEUR")
This will return the current exchange rate from USD to EUR. To convert a specific amount, say 100 USD, you can use:
=100 * GOOGLEFINANCE("CURRENCY:USDEUR")
This approach is beneficial for businesses or individuals dealing with multiple currencies.
5. Building a Dynamic Financial Dashboard
By combining various GOOGLEFINANCE functions, you can create a comprehensive financial dashboard. Incorporate real-time stock prices, historical data, and currency exchange rates into a single sheet. Utilize charts, conditional formatting, and pivot tables to enhance data visualization and analysis.
6. Automating Data Updates with Google Apps Script
While GOOGLEFINANCE updates data at regular intervals, you can automate the refresh process using Google Apps Script. This allows you to set triggers to update data at specified times, ensuring your information is always current.
7. Handling Errors and Limitations
It’s important to note that the GOOGLEFINANCE function has certain limitations:
- Data may be delayed by up to 20 minutes.
- Not all ticker symbols are supported.
- Some attributes may not be available for all securities.
To handle errors gracefully, you can use:
=IFERROR(GOOGLEFINANCE("GOOGL", "price"), "Data not available")
This will display “Data not available” if the function encounters an error.
8. Combining GOOGLEFINANCE with Other Functions
Enhance your analysis by combining GOOGLEFINANCE with other Google Sheets functions:
AVERAGE: Calculate the average price over a period.STDEV: Determine the standard deviation to assess volatility.VLOOKUP: Retrieve specific data points from a table.
For example, to calculate the average closing price for Google in 2024:
=AVERAGE(GOOGLEFINANCE("GOOGL", "close", DATE(2024,1,1), DATE(2024,12,31"), "DAILY"))
Conclusion
The GOOGLEFINANCE function in Google Sheets is a versatile tool that, when used creatively, can provide in-depth financial analysis and insights. By exploring its advanced capabilities, you can tailor your financial tracking to meet your specific needs and objectives.

Empowering you to master your money with confidence and clarity. On this channel, we break down personal finance—from budgeting basics and saving smarter to debt-free strategies and practical investing—all in easy-to-understand language.
Expect weekly deep dives into real-life financial questions, step-by-step tutorials, and expert insights that make money topics approachable and actionable. Whether you’re building emergency savings, paying off loans, or planning for the future, you’re in the right place to get informed, empowered, and financially confident.